
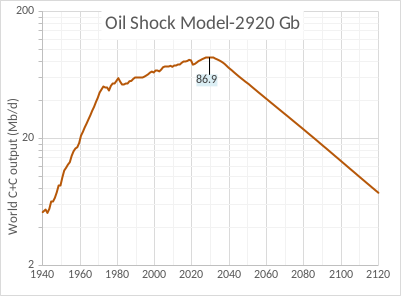
A conservative model of future World Crude plus Condensate (C+C) output is presented below with an average decline rate of 2.8% from 2040 to 2110. From 1933 to 1972 World C+C output increased at an average annual rate of about 7.8% and after the oil shocks in the 1970s and 1980s from 1983 to 2016 output increased at 1.2%/year on average. The decrease in the rate of change in World output was 6.5% between the high growth period up to 1972 and the slower growth period up to 2016. My model projects continued 1.2% average annual growth in C+C output from 2022 to 2029 when the final peak in output is projected. The annual rate of decline gradually increases to above 2.5% by 2039 and is followed by steady decline at 2.8% for the next 70 years. The decrease in the rate of change in output from the earlier period from 1983 to 2029 (about 1.2%) to the period after 2039 is 4%. Chart has a log vertical axis to indicate rates of change in output.
The chart below shows how this output is divided between conventional and unconventional oil, where unconventional oil consists of US light tight oil (LTO) and extra heavy (XH) oil from Canadian oil sands and Venezuelan Orinoco Belt.
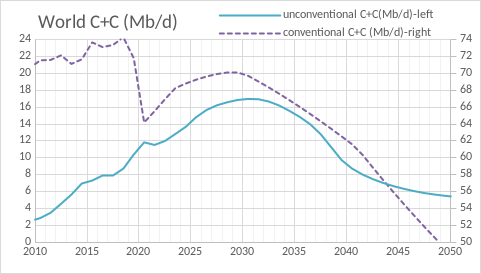
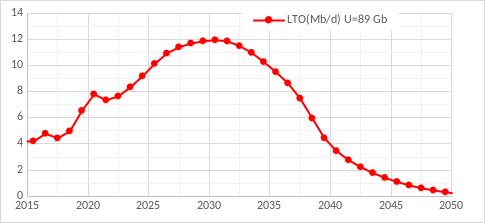
The extra heavy oil projection up to 2050 uses the Canadian Energy Regulator current policies scenario and assumes Orinoco output remains steady at 100 kb/d each year, after 2050 XH oil is assumed to decrease by 5% annually. The tight oil scenario has been revised to reflect expected Brent oil prices to remain high ($100/bo in 2021 $) until 2040 which leads to an increase in URR, previously I expected oil prices to decrease in 2030. The new tight oil scenario has a URR of 89 Gb compared to the previous scenario with a URR of 74 Gb, most of the difference is higher output after 2030.
For the chart below I show the extraction rate on the right axis which applies only to conventional oil, but the Oil output shown includes both conventional and unconventional oil.
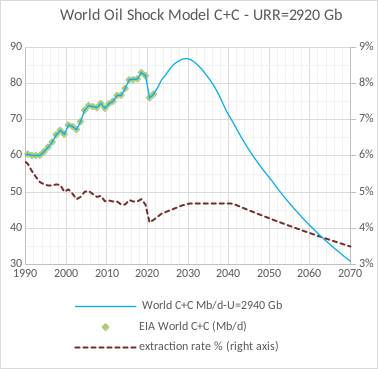
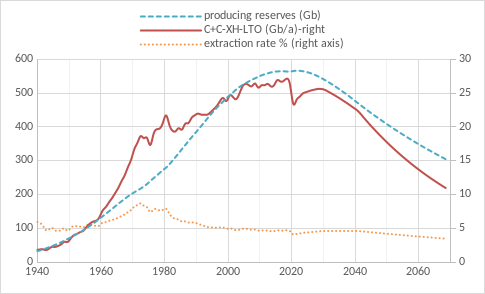
The chart below shows conventional output (C+C-XH-LTO) in Gb/year and the extraction rate on the right axis and producing reserves on the left axis in Gb at the end of a given year. Output is the producing reserves at the end of last year times the average annual extraction rate in the current year. Notice that producing reserves have been increasing from 1940 to 2017, they dipped a bit in 2018 and 2019 and then increased due to the low extraction rates in 2020 and 2021, the projection has the peak in producing reserves in 2021, these producing reserves represent conventional oil only, unconventional oil is modeled separately.
Some of the data for this model is in the spreadsheet linked here, the new reserves column comes from the oil shock model using a discovery model with 2750 Gb of conventional oil URR.